Which Function Does Logistic Regression Use?
By Ira Seidman — freelance healthcare Python data analyst and high school math teacher

The logistic regression sklearn model uses the logit link function which can take continuous data and fit a sigmoid curve to predict classes. The logit link function calculates the probability of success between 0 and 1 given however many features are passed in; after this calculation, the model will round up or down in the case of binary classification problems. Logistic regression models can also be used for multiclass classification problems both ordinal and non-ordinal — problems where the target classes are ranked compared to each other or they are not. The threshold for what is considered a success could be any value, but is set at .5 by default when there are just two classes.
The model does not predict a value for probability the way a linear regression model would predict a continuous value; rather, it calculates the odds of success given the sigmoid curve that was fit to the data and outputs those odds as a probability. I will explore the mathematics behind the logit link function which is used to make these probabilistic calculations and draw some distinctions between related functions.
Logit Link Function — Univariate:
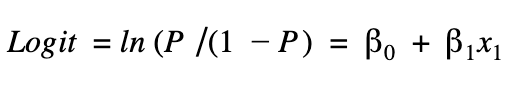
The logit link function for just one feature is defined as:

The e terms will always be positive no matter how large or small the value of x; because of this, the denominator will always be greater than the numerator. As the numerator can still approach 0 this is how the function outputs probability — a numerator that can approach both zero and the value of the denominator will give us a range of outputs between 0 and 1.
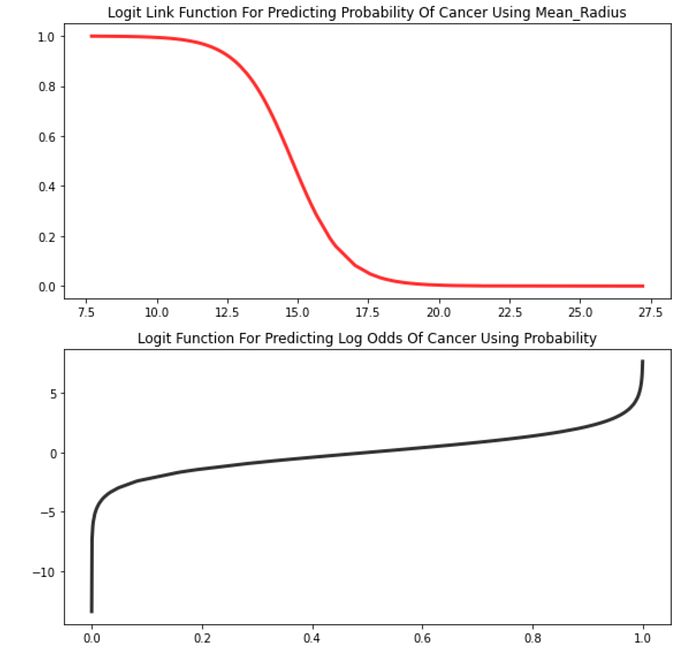
The terms are fit by the logistic regression model automatically and the math itself is complicated; the general idea of how the terms are fit is that there is a loss function that calculates for the maximum likelihood rather than the least square error as linear regression does. The results are more accurate than linear regression too, as can be seen from just using the mean_radius feature in sklearn’s breast cancer data set to predict tumors:
Likelihood and probability are very similar but the difference is whether we are referring to the odds of a certain model’s parameters being correct given the outcomes we observe versus the outcomes we observe being accurate given our model’s parameters. Probability refers to the ladder — the chance that we will see the predictions and data that we observe when the model is set up the way that it is. Likelihood deals with the odds of our model’s parameters being correct given the data that we have. For a more involved distinction between probability and likelihood definitely consider reading this Medium post.
The terms are optimized for the highest likelihood given the data that we have. To calculate the maximum likelihood we will quickly find ourselves using a pile of calculus which is beyond the scope of this post. Calculus is so prevalent because the model can use different loss functions to find where the smallest error lies between the data and the sigmoid we are trying to fit; these loss functions often work by looking for where the tangent = 0. If you are interested in learning more about the math behind this calculation I recommend starting with this Penn State resource and Don’t Sweat The Solver Stuff. For deeper delves into the intuition and mathematics of fitting coefficients to the logit link function please see this Stackoverflow thread and this sklearn documentation.
Logit Function:
The logit link function should not be confused with the logit function. The logit function finds the log odds of an outcome given a probability. Because it takes a probability, the domain only goes from 0 to 1 but the output actually goes from negative infinity to positive infinity. This Toward Data Science post can offer some more context, but the logit function is formally defined for one feature as:
The logit function’s output can go to infinity as x for a given feature goes to infinity, which makes sense because the log odds of something happening could theoretically be infinite. The logit function is the inverse of the logit link function:
Logit Link Function — Multivariate:
The multivariate logit link function is very similar to the univariate form just with more terms:
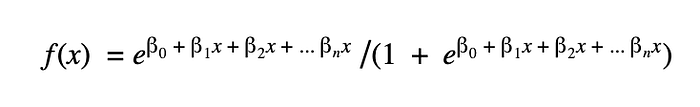
Once all the terms are fit, the probability of success can be calculated for any combination of feature x values. It is interesting to see how the curve shifts when features are added — even though the plots below show the same feature, the impact of adding columns to the model causes the sigmoid to shift and introduces discontinuities. This is similar behavior to how linear regression outputs shift up and down and are discontinuous as features get added. When looking at just one feature but holding other features constant to simulate all else being held equal, the sigmoid smooths back out again, as shown in plot 4:
Finally, it’s interesting to look at the weights of features using the .coef_[0] method. For logistic regression these values represent the increase in the log odds for every one unit increase in the feature (all else being held equal). For more info on .coeff check out this Toward Data Science article and for the coefficient values for the three-feature model shown above please see below:
Conclusion:
Some final notes to keep in mind are that certain solvers for logistic regression can under-perform without standard scaling and features should ideally be independent of each other. Oftentimes we will simply grid search over the parameters and let the accuracy scores speak for themselves, but with this insight into how the model is making predictions I hope you feel more confident pre-processing your data and interpreting your results.
Source Code and References:
Source code — GitHub
Data Academy — Machine Learning — (Univariate|Simple) Logistic regression
Data Academy — Statistics Learning — Multi-variant logistic regression
Medium — Probability vs Liklihood
Toward Data Science — ‘Logit’ of Logistic Regression; Understanding the Fundamentals
Penn State — Maximum Likelihood Estimation
Medium — Don’t Sweat the Solver Stuff
Toward Data Science — Interpreting Coefficients in Linear and Logistic Regression